
After facing a bearish rejection at a Fibonacci (Fib) resistance level, Ethereum (ETH) initiated a corrective movement. However, the trend is shifting as Ethereum’s price has encountered significant Fib support.
Ethereum appears to be demonstrating a bullish bounce at this support level, indicating the potential for the price to ascend further. This rebound from key Fib support suggests a possible resurgence in buying interest, possibly driving Ethereum’s price higher soon.
Bearish Trend Impacts Ethereum Price in January
Ethereum experienced a significant downturn last month, with a roughly 23% decline in price. However, current trends indicate a potential reversal, as the price appears to be regaining upward momentum this month.
Supporting this positive shift, the Moving Average Convergence Divergence (MACD) histogram on the monthly chart continues to display an upward trend. Additionally, the MACD lines remain in a bullish crossover, further suggesting bullish potential. Currently neutral, the Relative Strength Index (RSI) does not indicate overbought or oversold conditions, allowing room for price movement in either direction.

These indicators, particularly the bullish MACD and a neutral RSI, suggest that Ethereum may be positioned for a recovery or continuation of its upward trajectory following last month’s bearish phase.
Ethereum Price Shows Bullish Momentum from $2,255
After a sharp decline two weeks ago, with ETH hitting a horizontal support level at approximately $2,160, it managed to close above the 0.382 Fibonacci support level at around $2,255. Since last week, Ethereum has been showing bullish momentum from this level, potentially setting its sights back on the golden ratio resistance at approximately $2,550, where it faced a bearish rejection three weeks ago.
However, the MACD histogram has been trending downwards for four weeks, suggesting that the MACD lines might soon enter a bearish crossover.
Read More: Ethereum (ETH) Price Prediction 2024/2025/2030
The RSI on the weekly chart is currently neutral, providing no definitive signals towards bullish or bearish momentum. Should Ethereum break below the 0.382 Fib support at $2,255, and consequently the horizontal support at around $2,140, the next significant Fib support is expected at around $1,950.
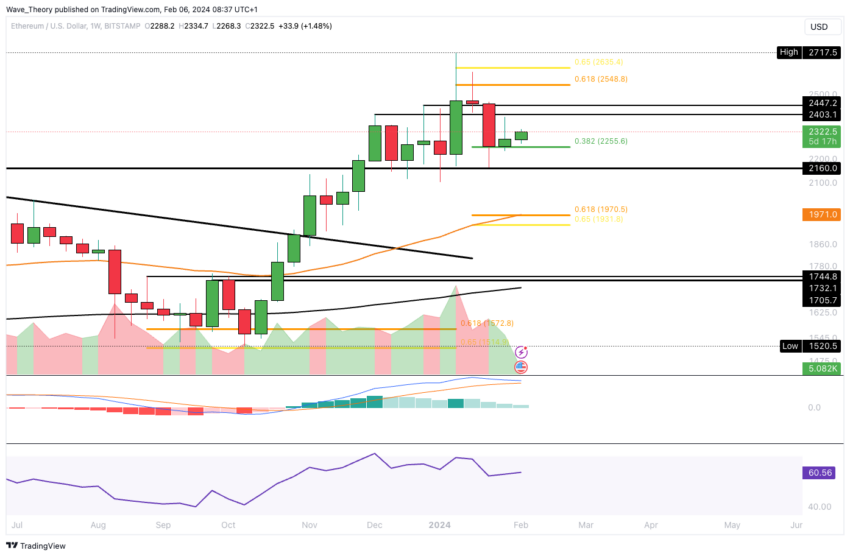
At this level, the 50-week Exponential Moving Average (EMA) could offer additional support, potentially stabilizing the price or providing a foundation for a rebound.
Ethereum’s MACD Signals Bullish Trend on Daily Chart
In the daily chart, the presence of a golden crossover in the Exponential Moving Averages (EMAs) suggests that the trend for ETH remains bullish in the short to medium term. Additionally, the Moving Average Convergence Divergence (MACD) histogram has been trending upward for several days, indicating the potential for the MACD lines to enter a bullish crossover soon.
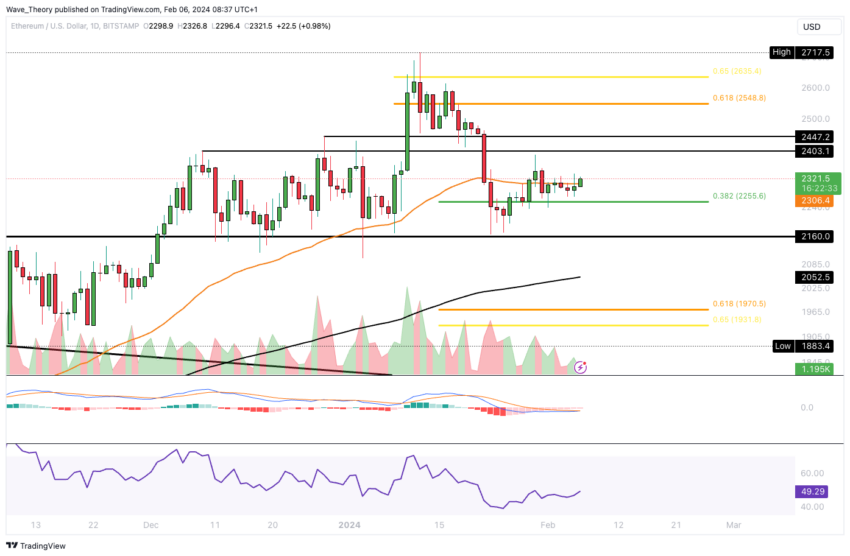
The RSI is currently in neutral territory, not providing clear indications of bullish or bearish momentum. This combination of a bullish EMA crossover, an upward-trending MACD histogram, and a neutral RSI suggests a generally positive outlook for Ethereum, albeit with an element of uncertainty as reflected by the neutral RSI.
Ethereum’s 4H Chart Forms Death Cross
The recent strong corrective movement in ETH has resulted in a death cross formation on the 4-hour (4H) chart, indicating a short-term bearish trend. A death cross occurs when a shorter-term moving average, like the 50-4H EMA, crosses below a longer-term moving average, such as the 200-4H EMA.
Read More: How to Buy Ethereum (ETH) and Everything You Need to Know
Contrastingly, the MACD presents a more optimistic picture, with the MACD lines in a bullish crossover and the histogram trending upwards, suggesting bullish momentum. The RSI remains neutral, offering no decisive direction for the market.
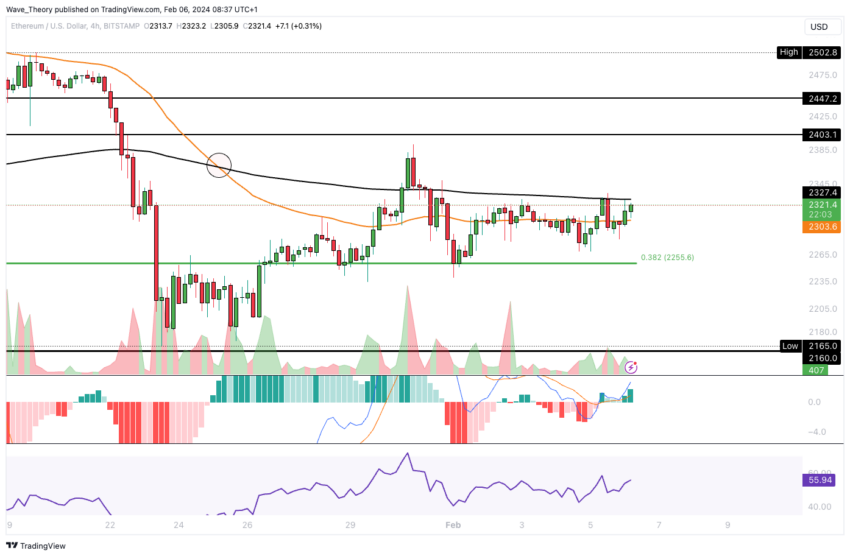
Ethereum is encountering resistance at the 200-4H EMA, currently around $2,327. Overcoming this barrier could lead to Ethereum facing the next significant resistance zone between approximately $2,400 and $2,450.
This scenario highlights a complex market situation for Ethereum, with bearish signals from the death cross juxtaposed against bullish indications from the MACD.
Bitcoin Dominance: Ethereum Price Meets Resistance at 50-Week EMA
In its pairing with Bitcoin (BTC), Ethereum faced a bearish rejection at the 50-week EMA resistance and a significant trend line resistance the week before. This rejection has contributed to a bearish sentiment, reflected in the MACD histogram, which has been trending downwards for three weeks. Despite this, the MACD lines remain in a bullish crossover, indicating some underlying momentum.
The Relative Strength Index (RSI) is currently neutral, not providing clear indications of market direction.
Read More: Ethereum Restaking: What Is It And How Does It Work?
Should Ethereum’s price continue to decline against BTC, a key Fibonacci support level is anticipated at around 0.043 BTC. Currently, ETH’s price is approximately 9% above this support level, suggesting that there is potential for further downward movement before this critical support is tested.
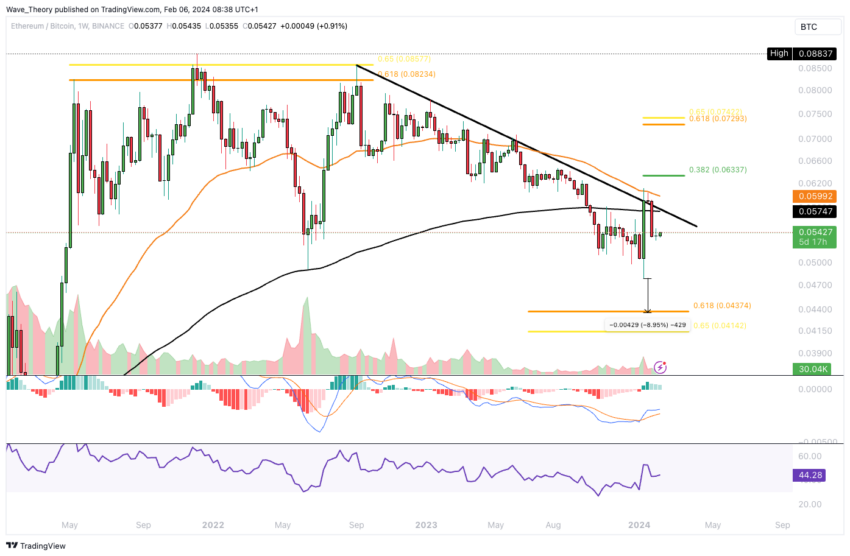
This scenario underscores the current bearish pressure on Ethereum in its BTC pairing, with the possibility of reaching significant support levels if the downward trend persists.
Disclaimer
In line with the Trust Project guidelines, this price analysis article is for informational purposes only and should not be considered financial or investment advice. BeInCrypto is committed to accurate, unbiased reporting, but market conditions are subject to change without notice. Always conduct your own research and consult with a professional before making any financial decisions. Please note that our Terms and Conditions, Privacy Policy, and Disclaimers have been updated.