The negative correlation between the U.S. Dollar Index (DXY) and the stock prices of the largest U.S. companies (SPX) may carry some clues for the cryptocurrency sector and Bitcoin (BTC). If the dollar ends its uptrend, both stock markets and cryptocurrencies could soon experience a recovery.
This possibility is particularly apparent when considering Bitcoin’s long-term performance against the S&P 500. Indeed, the clear signal confirming the bull market’s start in February 2023 appears intact.
It seems current that the Q3 correction, which took place in traditional markets and cryptocurrencies, may be coming to an end. If this happens and the U.S. dollar cools down, the coming months could continue the upward trend from earlier this year.
The Correction of the U.S. Dollar Index…
The weekly chart of the U.S. Dollar Index (DXY) shows an asset in a very strong uptrend. Since the bottom at 99.5, reached in July 2023, the DXY has generated 11 consecutive green bullish candles and is just closing in on 12.

Moreover, back in August, the dollar broke out of the declining resistance line (black). Then, in September, it broke through important resistance at 105.5 (red line). Both of these events are bullish signals that confirm the uptrend.
However, such a strong uptrend seems to be slowly waning. 12 consecutive green candles is a very rare event, after which a correction should be expected. The weekly RSI is slowly heading into overbought territory, and even a bearish divergence has already occurred on the daily indicator.
In addition, this week’s candle, with several hours left to close, may take the shape of an evening star or a gravestone Doji. Both formations contain long upper wicks, indicating selling pressure. Moreover, they often appear at the top of an uptrend and signal an impending correction.
If this happens, the nearest support level for the DXY is in the 104 area, which remains in confluence with the 0.382 Fib retracement level of the entire upward movement. On the other hand, the continuation of the uptrend may lead the DXY to the next area of resistance in the 108-109 range (red rectangle).
… Leads to S&P 500 Bounce
The upcoming correction on the DXY is in confluence with a potential bounce on the chart of the S&P 500. The index of the 500 largest companies in the U.S., which usually correlates negatively with the dollar, reached a local peak in July 2023 at $4607.
It is currently approaching the long-term support/resistance level at $4200 (green line). At the same time, this is the area of the standard correction at the 0.382 Fib retracement.
Moreover, the daily RSI is on the border of oversold territory and is just testing the long-term support line (blue circle), which it has already validated several times.
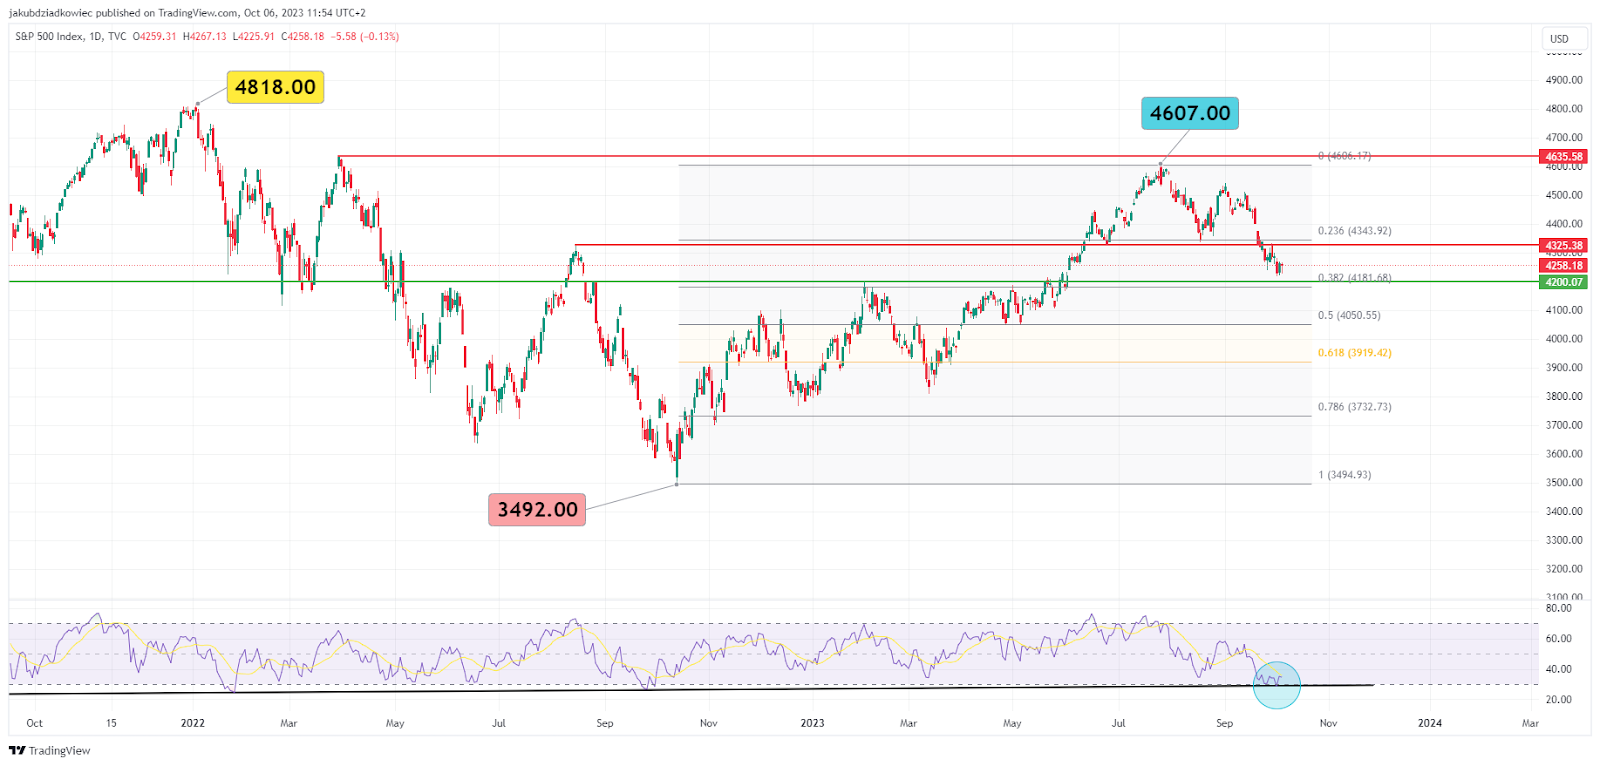
If the SPX holds this key support level, it could lead to a continuation of the uptrend. Then, the cards will break the local peak at $4,607 and move toward the all-time record high (ATH) at $4,818 in January 2022.
Bitcoin Lags Behind the S&P 500
The two trends outlined above – the ending DXY surge and the potential SPX bounce – have major implications for the cryptocurrency market and Bitcoin. Most notably, despite brief periods of lack of correlation, the BTC price remains positively correlated with the SPX index.
Well-known cryptocurrency market analyst @therationalroot recently published a chart of the two assets on X. It clearly shows that the S&P 500 (blue) and Bitcoin (orange) seem to be moving very close since 2020.

However, an interesting phenomenon has emerged in the past few months, when the two charts have clearly separated. The S&P 500 continued its upward trend and approached its ATH at just 4.5%.
Conversely, Bitcoin has not experienced a strong continuation of the upward trend during this time and is consolidating. Moreover, it still remains about 60% below its November 2021 ATH.
However, it is possible that the BTC price will increase its volatility after this transitional period of lagging behind the SPX. Then, there is a chance that the last quarter of 2023 will bring better returns than traditional markets.
The Bullish Signal Remains Intact – the Beginning of a Bull Market
Bitcoin’s correlation with the S&P 500 still has a double bottom. It turns out that historically, the performance that the largest cryptocurrency had against the SPX index has been a good indicator for cryptocurrency bull and bear markets.
Macroeconomist and financial cycles analyst @HenrikZeberg published a long-term chart of BTC/SPX on X. He showed how periods of strong uptrends on SPX overlapped with BTC bull markets.
The difference remains the magnitude of the returns (and declines). While SPX in the previous two cycles helped to earn about 40%, BTC generated 45x returns in 2015-2018 and 6x returns in 2019-2021.
According to the analyst, confirmation of the bull market and the “risk on” period was the upward crossing of the signal line (green) by the monthly RSI indicator for the BTC/SPX pair.
These are golden areas. The opposite signal was the downward crossing marked by the red areas.
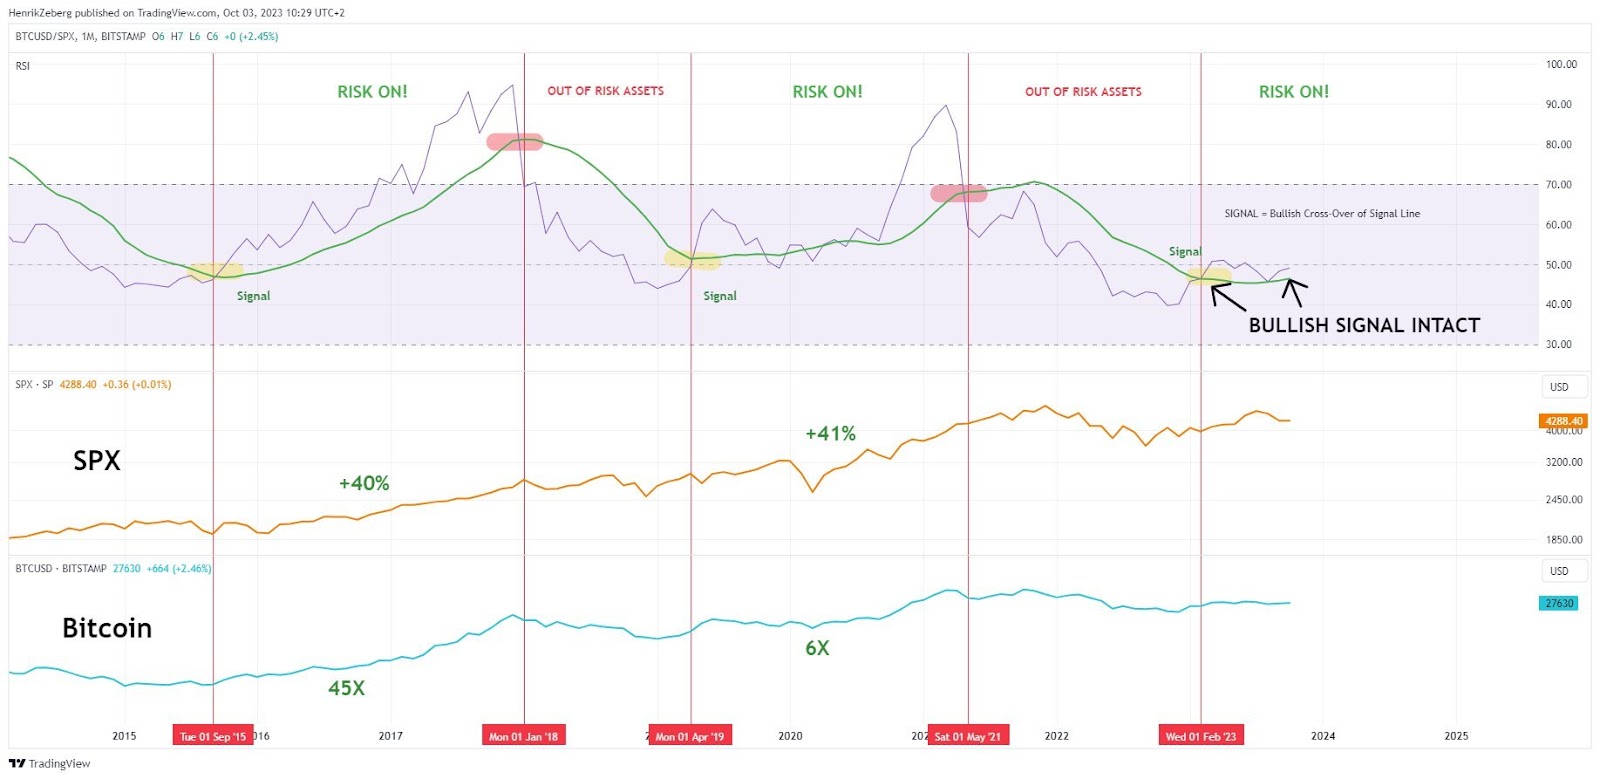
The latest part of the chart shows that an upward signal last appeared in February 2023. Bitcoin began generating more gains than the S&P 500, and the RSI of the BTC/SPX pair fired upward.
Despite a minor correction, the RSI remains above the green line, indicating that the bull market remains intact.
A correction on this indicator and another touch of the green line could signal a bullish retest. This remains in confluence with a potential bounce on the SPX chart and the end of the uptrend for the U.S. dollar.
If the signals are confirmed, the cryptocurrency market and Bitcoin could soon enter a mature bull market phase.
For BeInCrypto’s latest crypto market analysis, click here.
Disclaimer
In line with the Trust Project guidelines, this price analysis article is for informational purposes only and should not be considered financial or investment advice. BeInCrypto is committed to accurate, unbiased reporting, but market conditions are subject to change without notice. Always conduct your own research and consult with a professional before making any financial decisions.