Invest In Crypto News
  • Home
  • Latest News
    • Bitcoin News
    • Altcoin News
    • Ethereum News
    • Blockchain News
    • Doge News
    • NFT News
    • Video
    • Market Analysis
    • Business
    • Finance
    • Politics
    • Mining
    • Regulation
    • Technology
  • Top 10 Cryptos
  • Market Cap List
  • IC DAO
  • Donations
  • Contact
  • Buy Crypto
  • BLOG
No Result
View All Result
Invest In Crypto News
  • Home
  • Latest News
    • Bitcoin News
    • Altcoin News
    • Ethereum News
    • Blockchain News
    • Doge News
    • NFT News
    • Video
    • Market Analysis
    • Business
    • Finance
    • Politics
    • Mining
    • Regulation
    • Technology
  • Top 10 Cryptos
  • Market Cap List
  • IC DAO
  • Donations
  • Contact
  • Buy Crypto
  • BLOG
No Result
View All Result
Invest In Crypto News
No Result
View All Result

Sonic (S) Jumps 50% in 7 Days, Market Cap Hits $2.5 Billion

CryptoExpert by CryptoExpert
February 20, 2025
in Market Analysis
0
Sonic (S) Surges Over 50% In a Week, Market Cap Surpasses $2.5 Billion
  • Facebook
  • Twitter
  • Pinterest


You might also like

XRP rebounds from $1.32 as Standard Chartered adds RLUSD custody

$9 Breakout in Focus as Injective ETF Hopes Grow

XRP rebounds as derivatives improve, but faces EMA resistance

Sonic (S) is currently experiencing strong bullish momentum, with its price up nearly 15% in the last 24 hours and 53% over the past seven days. Its market cap now stands at $2.6 billion, reflecting growing investor interest and heightened trading activity.

Technical indicators show that Sonic’s ADX is at 51.6, confirming the strength of the ongoing uptrend. Its RSI of 78.4 suggests that buying pressure remains intense, although overbought conditions could lead to short-term pullbacks. Sonic could test resistance levels at $0.849 and potentially $1.06.

Sonic ADX Shows the Current Uptrend Is Strong

Sonic, formerly Fantom (FMT), ADX is currently at 51.6, showing a significant increase from 34 just three days ago and an even more dramatic rise from 19.8 eight days ago.

The rising ADX indicates a strengthening trend, reflecting growing market momentum. This rapid upward movement suggests that Sonic is experiencing increased volatility and directional strength, which could be indicative of heightened buying interest or intensified market activity.

okex

Given the current uptrend, this surge in ADX could be interpreted as a confirmation of the ongoing bullish momentum, signaling that the price movement is gaining strength and may continue in the same direction.

Sonic ADX. Source: TradingView.

The Average Directional Index (ADX) is a momentum indicator used to measure the strength of a trend, regardless of its direction. It does not indicate whether the trend is bullish or bearish, only its intensity.

Typically, an ADX below 20 suggests a weak or non-existent trend. Between 20 and 40 indicates a growing trend, while values above 40 signify a strong trend. With Sonic ADX at 51.6, the market is showing a powerful trend, supporting the current uptrend.

This Sonic strong momentum could lead to further price appreciation as it suggests sustained buying pressure. However, traders should watch for potential overextension or reversal signals as the trend matures.

S RSI Has Been Overbought For More Than a Day

Sonic’s RSI is currently at 78.4, a significant increase from 56 just two days ago. It has remained above 70 for more than a day, indicating strong upward momentum.

The rapid rise in RSI reflects heightened buying activity, suggesting that the bullish sentiment is intensifying. An RSI above 70 typically signals overbought conditions, implying that the asset may be overvalued in the short term.

Given the current uptrend, this elevated RSI could indicate continued buying interest; however, it also raises the possibility of a price pullback or consolidation as traders may begin to take profits.
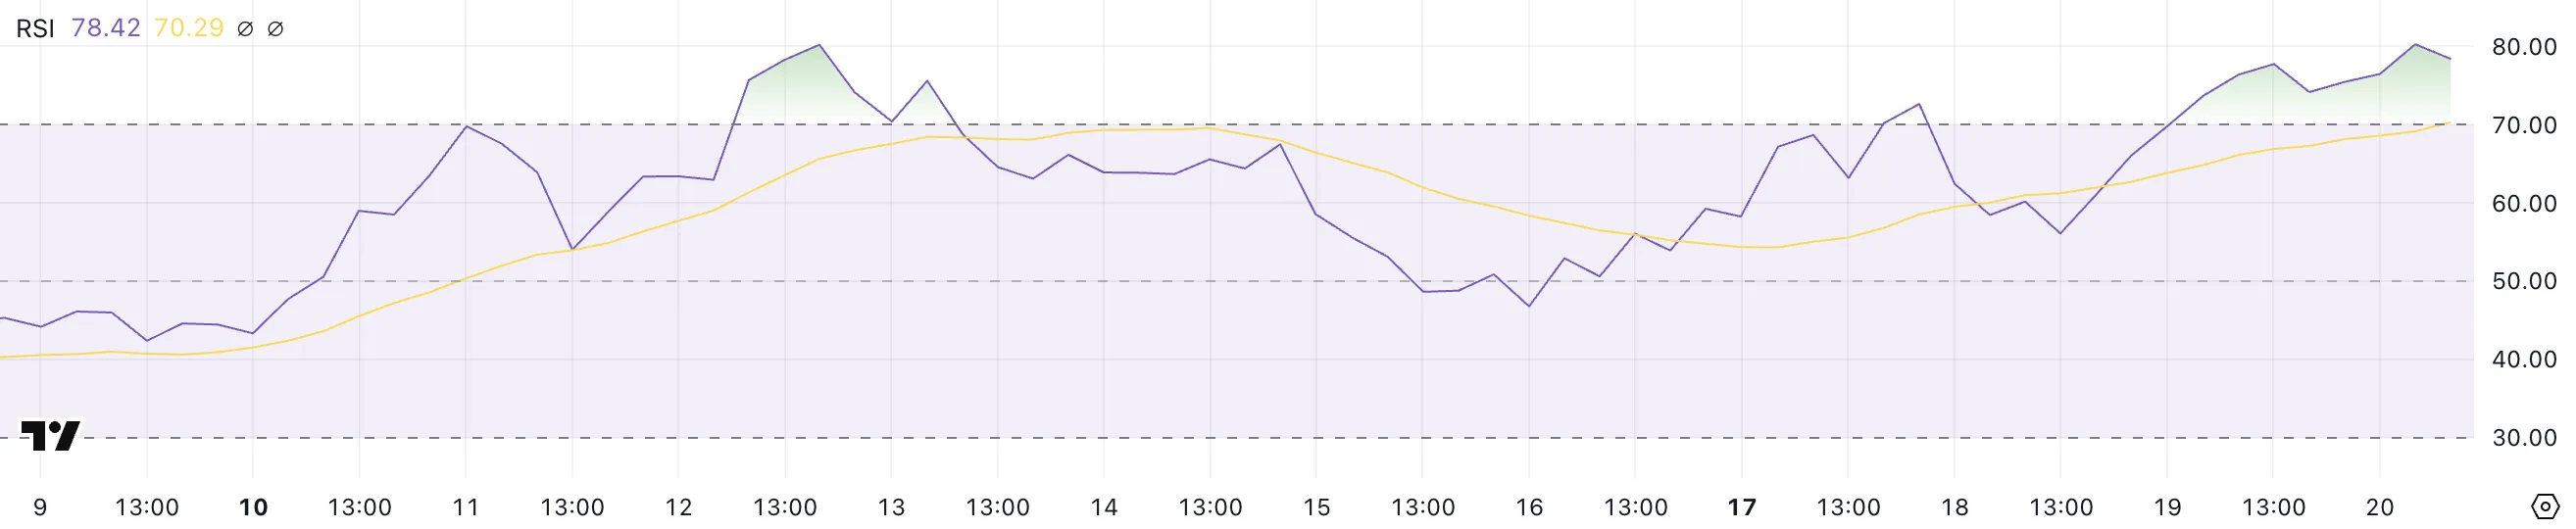
Sonic RSI.
Sonic RSI. Source: TradingView.

The Relative Strength Index (RSI) is a momentum oscillator that measures the speed and change of price movements. It ranges from 0 to 100 and helps identify overbought or oversold conditions.

Generally, an RSI above 70 suggests the asset is overbought and could be due for a correction, while an RSI below 30 indicates oversold conditions, potentially signaling a buying opportunity. With Sonic’s RSI at 78.4, the asset is clearly in the overbought territory, which could lead to a short-term pullback or consolidation as traders capitalize on recent gains.

However, in strong uptrends, RSI can remain overbought for an extended period. This suggests that Sonic bullish momentum may continue before any significant correction occurs.

Will Sonic Break Above $1 In February?

Sonic’s EMA lines have recently formed two golden crosses, signaling strong bullish momentum. A golden cross occurs when a shorter-term EMA crosses above a longer-term EMA, typically indicating the start of an uptrend. If this bullish momentum continues, Sonic could test the resistance at $0.849.

Should it break through this level, the next price target for Sonic would be $1.06. That would mark its highest price since the end of December 2024. This would confirm the ongoing uptrend and could attract more buying interest, pushing Sonic prices higher as bullish sentiment strengthens.

Sonic Price Analysis.
Sonic Price Analysis. Source: TradingView.

However, if the trend reverses, Sonic could face significant downside risks. The first support levels lie at $0.65 and $0.58, which, if breached, could open the door to further declines.

In this bearish scenario, Sonic might drop as low as $0.47. In the worst case, it could reach $0.37, representing a correction of over 50%.

Disclaimer

In line with the Trust Project guidelines, this price analysis article is for informational purposes only and should not be considered financial or investment advice. BeInCrypto is committed to accurate, unbiased reporting, but market conditions are subject to change without notice. Always conduct your own research and consult with a professional before making any financial decisions. Please note that our Terms and Conditions, Privacy Policy, and Disclaimers have been updated.



Source link

  • Facebook
  • Twitter
  • Pinterest
CryptoExpert

CryptoExpert

Recommended For You

XRP rebounds from $1.32 as Standard Chartered adds RLUSD custody

by CryptoExpert
October 14, 2026
0
XRP rebounds from $1.32 as Standard Chartered adds RLUSD custody

Key takeaways XRP bounced from $1.32 following news of Standard Chartered’s involvement in an RLUSD custody arrangement. The deal with Ripple and LMAX would allow institutional clients to...

Read more

$9 Breakout in Focus as Injective ETF Hopes Grow

by CryptoExpert
October 14, 2026
0
$9 Breakout in Focus as Injective ETF Hopes Grow

Injective (INJ) is approaching a key resistance zone as ETF expectations and network developments bring renewed attention to the token. After recovering from its August lows, INJ is...

Read more

XRP rebounds as derivatives improve, but faces EMA resistance

by CryptoExpert
October 13, 2026
0
XRP rebounds as derivatives improve, but faces EMA resistance

Key takeaways XRP traded near $1.374 on Tuesday after Monday’s correction. Long-to-short ratios of 1.09 for XRP indicate a modest tilt toward longs. Immediate XRP support sits at...

Read more

Dogecoin rebounds from $0.0800 as ETF outflows keep downside risks in focus

by CryptoExpert
October 13, 2026
0
Dogecoin rebounds from $0.0800 as ETF outflows keep downside risks in focus

Key takeaways Dogecoin traded near $0.084 on Tuesday after rebounding from an intraday low around $0.0800. DOGE-focused ETFs recorded $399,460 in outflows Monday following no net flows last...

Read more

Cardano reclaims $0.250 as derivatives sentiment improves

by CryptoExpert
October 12, 2026
0
Cardano reclaims $0.250 as derivatives sentiment improves

Key takeaways ADA’s long-to-short ratio edged above one to 1.01, indicating a slight tilt toward bullish positioning. Funding turned positive and reached 0.0061%, with longs paying shorts. ADA...

Read more
Next Post
How OKX Achieved MiCA Compliance and What It Means for Users Across Europe

OKX Now Fully Licensed Under MiCA to Operate Across the EU

Leave a Reply Cancel reply

Your email address will not be published. Required fields are marked *

Browse by Category

  • Altcoin News
  • Bitcoin News
  • Blockchain News
  • Business
  • Doge News
  • Ethereum News
  • Finance
  • Market Analysis
  • Mining
  • NFT News
  • Politics
  • Regulation
  • Technology
  • Trending Cryptos
  • Video

Sitemap

  • Market Cap
  • Donations
  • Trading
  • Mining
  • Contact

Legal Information

  • Privacy Policy
  • Anti-Spam Policy
  • Copyright Notice
  • DMCA Compliance
  • Social Media Disclaimer
  • Terms Of Service

Categories

  • Altcoin News
  • Bitcoin News
  • Blockchain News
  • Business
  • Doge News
  • Ethereum News
  • Finance
  • Market Analysis
  • Mining
  • NFT News
  • Politics
  • Regulation
  • Technology
  • Trending Cryptos
  • Video

© Copyright 2024 InvestInCryptoNews.com

No Result
View All Result
  • Home
  • Latest News
    • Bitcoin News
    • Altcoin News
    • Ethereum News
    • Blockchain News
    • Doge News
    • NFT News
    • Video
    • Market Analysis
    • Business
    • Finance
    • Politics
    • Mining
    • Regulation
    • Technology
  • Top 10 Cryptos
  • Market Cap List
  • IC DAO
  • Donations
  • Contact
  • Buy Crypto
  • BLOG

© Copyright 2024 InvestInCryptoNews.com

This website is using cookies to improve the user-friendliness. You agree by using the website further.

Privacy policy
bitcoin
Bitcoin (BTC) $ 83,635.00
ethereum
Ethereum (ETH) $ 2,509.46
tether
Tether (USDT) $ 0.999269
bnb
BNB (BNB) $ 742.97
xrp
XRP (XRP) $ 1.38
usd-coin
USDC (USDC) $ 0.99977
solana
Solana (SOL) $ 107.42
tron
TRON (TRX) $ 0.333464
staked-ether
Lido Staked Ether (STETH) $ 2,265.05
figure-heloc
Figure Heloc (FIGR_HELOC) $ 1.03

Pin It on Pinterest

Are you sure want to unlock this post?
Unlock left : 0
Are you sure want to cancel subscription?